If you aren’t familiar with a procedure called, “Analysis of Variance (ANOVA),” it’s basically used to compare multiple group means against each other and determine if they are different or not. We can determine how similar or dissimilar multiple groups’ means are from one another by asking the question, “How much of the difference is due to groups, as opposed to individual differences?” For example, we might want to claim that Winter temperatures differ depending on whether you’re in Illinois, Indiana or Ohio. However, over the course of ten days we find that the average temperatures were 30, 31 and 30.5 degrees Fahrenheit, respectively. Are they really that different? That is when statistical tests come in handy. So, how does ANOVA work? This article won’t be so much about how to run an ANOVA or an F-test, but rather to run through the logic behind it; understanding the basic logic has always aided me in remembering when and why to use each model as well as understanding the limitations of each model — hopefully this can do the same for you!
In statistics, variance is basically how spread out your data is. Let’s say that you are interested in how anxious individuals at your school are. You might look at a sample of your fellow schoolmates (from different majors, and not necessarily your own friends) and administer an anxiety battery (basically a survey) which will yield anxiety scores. If the anxiety scores across all your participants are similar, we say that there is small variance (narrower curve — blue). However, if the anxiety scores vastly differ from person to person, then we say that we have large variance (wider curve — orange). However, why should we analyze variances when we’re interested in comparing means (averages)?
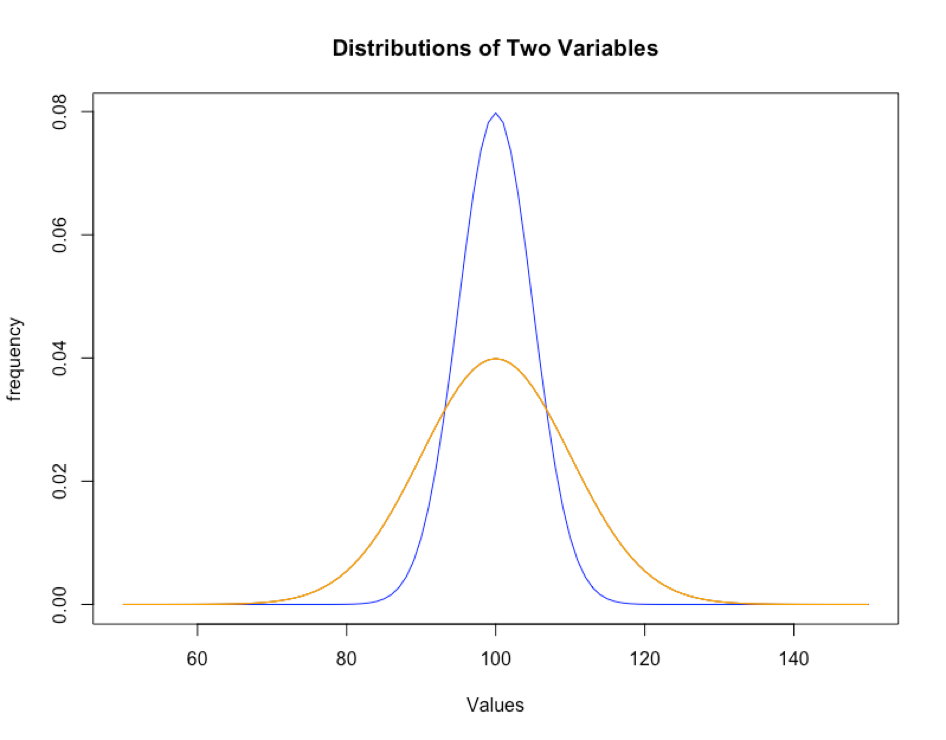
Narrow (blue curve) shows low variance; Wide (orange) curve shows higher variance.
Consider for a moment a psychologist who is interested in whether exercising or meditating is more effective in reducing anxiety. She can run an experiment and randomly assign people into two groups: 1) exercise group and 2) meditation group. At the end, she can look at how much anxiety scores decreased, on average, between the two groups. We can ask ourselves two questions. First, was one more successful than the other at reducing anxiety, or were both equally as successful? In other words, did being in a particular group lead to a different outcome (amount of anxiety reduction)? Or, were the differences just due to individual differences? The first question is referring to variance between groups — how different were the groups from one another in the outcome (anxiety reduction)? The second question was referring to overall variance between individuals — how different were people from one another (regardless of group)? If a lot more of the difference in anxiety reduction is due to which group you got assigned to, compared to random individual differences, then we say that there is a significant difference between the two groups in the average amount of anxiety reduction.

To wrap things up, ANOVA compares the amount of group variation due to the amount individual variation, allowing us to determine if groups are actually different or not, on average. The formal inference test will be the F-test, and like other inference tests, we’ll obtain a test statistic (in our case, F) and a p-value. In fact, the F-statistic is constructed by dividing the average amount of variance (differences) between groups by the average amount of variance (differences) between people — we’re looking at a ratio!
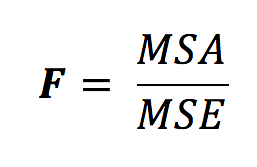
Let’s take this apart piece by piece. In the numerator (the top half of the fraction), we have MSA, which is short for “mean squared error for factor A.” In other words, our factor A is our treatment groups! Do you remember what they are? Essentially, to get this value, we look at each group’s average amount of anxiety reduction. On average, how much anxiety was reduced in the meditation group? And on average, how much anxiety was reduced in the exercise group? Now, let’s look at how each of these group averages differ from the overall, grand reduction in anxiety (collapsed across all groups). That, in essence, is what the MSA is trying to capture – how much of the difference in anxiety reduction was due to treatment?
Then, in the denominator (the bottom half of the fraction), we have the MSE, which is short for “mean squared error.” This is simply the overall variability in how much each individual’s anxiety score decreased, compared to the overall (mean) decrease. For example, you might have experienced a reduction in anxiety by 3 points, I might have experienced a reduction in anxiety by 1 point, and on average, everyone in the study decreased by 2 points. That means that you were one point above the average and I was one point below. So, in essence, the MSE is trying to capture how much variability, on average, is seen between all individuals in our study.
However, this leads to a drawback. If we choose to use an ANOVA to compare 3+ group means, we cannot identify how the groups differ from another. For example, we cannot tell [from this test] if group 1 was greater than both groups 2 and 3); we can only detect if there is a difference at all between the groups. But don’t worry – there are other tests available for this.

So, this concludes our logical breakdown of ANOVA. As we’ve seen, it’s often difficult and ambiguous to just look at averages alone. We saw this in our initial example in weather, and then again in treatments. Statistics can prove useful in this way by incorporating other important factors such as variance in helping us make more disciplined judgements. And understanding the basic logic behind each statistical model was always helpful for me in determining which statistical test to use, and hopefully this helps you in becoming more confident in choosing ANOVA when it best fits your purpose!