We all experience uncertainty: How did I do on that test? What do they think of me? Where did I leave my keys? Is my phone ringing? In these and other uncertain situations, we have to take the evidence we have and make our best guess about the answer. Sometimes we’re right, and sometimes we’re wrong. Sometimes how we respond is biased – like assuming every sound or vibration is the phone when you’re waiting for an interview or job offer. Signal detection is a theory, research method, and statistical method for explaining and measuring how we act under uncertainty. Theory:
Under basic signal detection theory (SDT) there are two situation dimensions, world state and your level of evidence. Take weather forecasts as an example: if the forecast is that it will rain at 4pm (not here in LA, but somewhere), when it gets to 4pm it will be either 100% raining or 100% not, one of two mutually-exclusive world states. We call when the stimulus is present (here, rain) the signal and when it’s absent (here, no rain) noise – notice that signal and noise are mutually exclusive categories.
But when forecasters are predicting the weather, all they have access to is various evidence (barometric pressure, humidity, etc.) about what the weather might be later. So they use their evidence to make their best predictions, setting some threshold above which they predict rain and below which they don’t. With weather, you definitely can find out the world state. In other signal detection situations, you might occasionally find out what the world state is – if you keys are where you thought – but not always. In psychology, the evidence dimension – the only dimension you have direct access to – can be sensory or perceptual evidence, memory, etc., such as how clearly and how accurately you remember what you did with your keys. Threshold, also called criterion and decision boundary, is the level of evidence above which you (consciously or unconsciously) think that the signal is present and below which you think the signal is absent.
Crossing the two situation dimensions, world state and evidence, yields four possible outcomes: hit, miss, false alarm, and correct rejection. Continuing with our rain example, sometimes weather forecasters will correctly predict rain. This is a hit – when the world state is that the signal (rain) is present, and the level of evidence was above the threshold, high enough that the forecast was rain. If it rains, but the forecast wasn’t rain, then we call that a miss – when the signal is present, but the level of evidence was below threshold. Together, hits and misses make up 100% of times when the signal is present.
Our other two outcomes add up to 100% of times when there is no signal. The name correct rejection tells us that the level of evidence led to the correct decision: low evidence, such as for rain, correctly predicted the world state, such as not raining. If the level of evidence for rain was high enough to be above threshold leading to the prediction of rain, but it didn’t rain, we call this a false alarm.
Statistical Method:
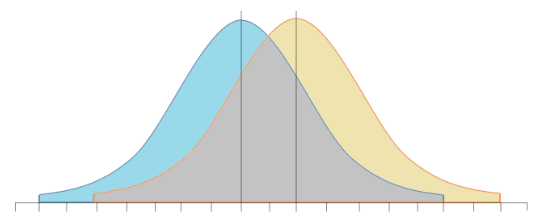
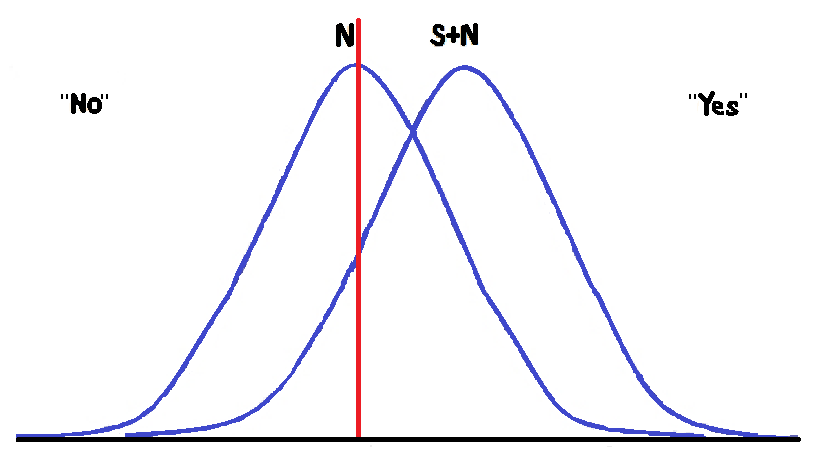
Each of the world states is statistically represented by a normal distribution because perception is probabilistic. There are always potential distractions in us and in the environment that prevent us from perfectly or even consistently taking in stimuli. Distractions in us, called internal noise, are things like feeling hungry or spacing out or blinking. Environmental distractions, external noise, could be someone walking by or a flickering light or a change in room temperature. When the signal is absent, external and internal noise fully explain whatever level of evidence we have, which is why we call this case noise.
Our ability to distinguish the signal (such as rain) from noise is what we call sensitivity and we measure sensitivity with d’ (“d-prime”). d’ is the distance from the peak of the noise distribution to the peak of the signal distribution. Response bias is your tendency to say yes or no to different levels of evidence, or where you put your threshold. If you live in LA like I do, you might be biased to say no – that there is no signal (rain) – for even medium-high levels of evidence because LA is in a drought. Notice that biasing your responses can be completely reasonable (it seldom rains here). You have a response bias from a threshold that is statistically either higher or lower than exactly in the middle of your d’. The unbiased threshold is the point at the middle of your d’ where the curves intersect; it is also the point of maximum accuracy. But if your goal is to keep your good shoes dry at all costs, being accurate about whether it’s going to rain or not by having the unbiased threshold doesn’t matter. You are more likely to meet your goal if you shift your threshold down and predict signal (rain) from even low levels of evidence.
Research Method:
Psychologists can engineer situations with uncertainty to learn about how we think and behave. Signal detection as a research method can be used to study marketing (Which ad did you see?), Autism Spectrum Disorder visual deficits (Which interval had a normal point-light walker?), and learning and memory (Does your sensitivity improve with learning?). Any time you or a psychologist might be interested in whether something is present or absent, the same or different, or present to some degree you can set up a signal detection study that can be analyzed with the statistics described above*.
In sum, signal detection is a powerful tool for engineering, understanding, and analyzing situations with uncertainty.
*Note: there are extensions of basic signal detection for situations with three or more response options, or for different-width signal and noise distributions, etc.
Photo credit: “Yellow umbrella” by Christoph Michels – Own work. Licensed under CC BY 2.5 via Wikimedia Commons – http://commons.wikimedia.org/wiki/File:Yellow_umbrella.JPG#/media/File:Yellow_umbrella.JPG