I listen to a lot of podcasts in which various psychological articles are often discussed (e.g., stuff you should know, radiolab, etc.). As a psychologist, I am often frustrated when a podcast mentions a study’s finding (e.g., having a sister is associated with better self-esteem than having a brother) but then says something like this: “well, I’m kind of suspicious of that finding/we should take that finding with a grain of salt/I kind of question that finding because I don’t think that’s the whole story/I have a brother and my self-esteem is great.”
I get frustrated because a little bit more information about effect sizes would help turn those kind of statements from ones that undermine and disregard what are often interesting, useful findings into the kind of statements that would help people understand exactly how useful those findings are.
So, with that in mind, let’s talk about effect sizes. Usually, when you hear someone talk about a study, if they say that something is associated with something or there’s a difference between two things, that means that the study found a statistically significant effect, which most of the time means that the effect they found is different from 0 at at least 95% certainty. With regards to the sisters and self-esteem example, this means that the relationship between having a sister and self-esteem is different from 0 at at least 95% certainty. That’s interesting information, sure, but it doesn’t tell you anything about the strength or size of that relationship. Different from 0 just means that the strength of the relationship could be anywhere from just a tiny bit above 0 to a huge number.
This is where effect sizes come in. Effect sizes give you some information, like you might expect, about the size of the effect, which is much more useful than simply knowing that the effect is different from 0. When you know something about the effect size, you can understand that the effect of having a sister may not be able to explain everything about self-esteem (hence the counter-examples you can think of) but it can explain something, which makes it useful. Understanding effect sizes gives you a sense of just how useful.
I’m going to go over two commonly-used effect sizes: R-Squared and Cohen’s d.
R-Squared
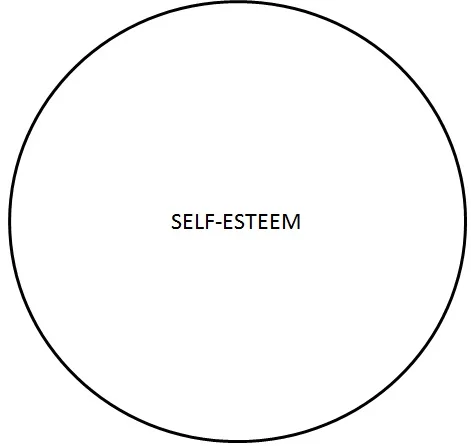
Let’s stick to the sister/self-esteem example here. Let’s imagine that someone does a study of self-esteem and that all of the self-esteem data from the study is represented in the circle below.
 We can also talk about this circle as showing 100% of the variance (how much people in the study differ from each other) in self-esteem; if we could explain 100% of the variance, we could predict the exact self-esteem everyone in the study has. Let me say right off that no study in psychology ever does this; if you find a study that comes even close, be very, very suspicious. Why? Because there is so much that goes into self-esteem, or any other psychological construct, for that matter, that it would be very difficult to capture it all in one study. For example, part of self-esteem could be explained by having a sister, part of it by how you happened to feel that morning, part of it by your relationship with your parents, part of it by how the experimenter looked at you when you first came in, and so on, so on.
So when a study reports a statistically significant association between having a sister and self-esteem, that means that having a sister explains more than 0% of the variance in self-esteem. That means that having a sister might explain anywhere from .001% of the variance to 99% of the variance.
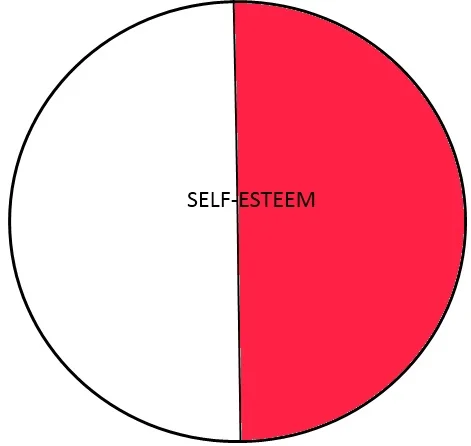
What R-Squared tells you is what percentage of the total variance in self-esteem is explained by having a sister; it’s that easy. If a study reports an R-Squared of .5, that means that 50% of the total variance in self-esteem is explained by having a sister (shown in red below).
 Another quick thing to note about R-Squared before I move on is that R-Squared is most commonly used as a measure of how much variance is explained by a set of predictors. For example, if a study says that when trying to explain self-esteem from having a sister, parental relationship, and body image, they found an R-Squared of .62, that means that 62% of the variance in self-esteem was explained by a combination of having a sister, parental relationship, and body image.
Cohen’s d
In order to talk about Cohen’s d, we need to think about our example in a slightly different way. Let’s say a study shows that there is a statistically significant difference in self-esteem between two groups: one that has a sister (group a) and one that does not (group b). Remember from before that knowing that there is a statistically significant difference in self-esteem between the two groups means only that the difference between the two groups is different from 0. That could mean that the self-esteem score in group a is 5 and in group b is 4.5, or that the self-esteem score in group a is 5 and in group b is 2.
Cohen’s d is pretty simple. It takes the literal difference between the two groups (groupa self-esteem – groupb self-esteem) and then divides it by the standard deviation of the data (a measure of how much the data varies). It’s easiest to explain why the difference is divided by the standard deviation using an example.
Let’s say we want to know how big the difference is between how much a garden snail weighs on day 1 and day 2 (after eating a big meal on day 1). Let’s say that difference is .02 ounces. Is that big? Is that small? The number itself is very small but does that mean that the difference is actually small? Let’s say the difference between how much an elephant weighs on day 1 and day 2 (after eating a big meal on day 1) is 3.4 lbs. Is that big? Compared to the .02 ounces for the snail, that’s huge! The problem with looking at the raw difference is that we don’t know what an “average” difference in snail weight or elephant weight actually is so we can compare it to the difference we care about. If we knew that elephants actually fluctuate in weight day-to-day even without a big meal by about 3.35 lbs, that 3.4 lbs doesn’t seem like that big of a deal. Similarly, if we know that snails actually fluctuate in weight day-to-day even without a big meal by about .001 ounces, that .02 ounces is a very large difference.
Cohen’s d allows us to understand the size of a difference, even across completely different comparisons. Using Cohen’s d, we can compare the size of the difference between a snails’ weight from one day to another to an elephant’s weight from one day to another.
Conveniently, Cohen gave us some guidelines for interpreting d. He said that .2 – .3 is a “small” effect, around .5 is a “medium” effect, and .8 and above is a “large” effect.
A Final Note on Effect Sizes
It’s important to remember that effect sizes need to be taken in context with the rest of the study. If the study is on a topic we already know a lot about, explaining a tiny bit of variance (a small R-Squared) or a small Cohen’s d is not very impressive. However, if the study is on a topic we know nothing about and is breaking new ground, small effect sizes can still be provocative and useful – they can mean that the study gives us some information as a starting point for future research! The best way to be a good consumer of science is to try to use as much information as possible before drawing your conclusions. It’s a little more difficult than just reading a headline, but science is complicated, particularly the science of human behavior, thought, and emotion.
I hope this quick tutorial on effect sizes is helpful. I’ve only gone over two here – there are many other kinds of effect sizes. A more mathematically-involved outline of effect sizes is available on Wikipedia (http://en.wikipedia.org/wiki/Effect_size), and a less mathematically-involved outline of effect sizes is available here (http://www.leeds.ac.uk/educol/documents/00002182.htm). A google search will reveal many other resources on effect sizes and their interpretation.