The human brain is a fascinating organ about which we know relatively little. We’ve been working to uncover the brain’s secrets for centuries using numerous methods, from in vitro methods like dissecting human and animal brains to in vivo methods like positron emission tomography (PET) and magnetic resonance spectroscopy (MRS). In this post, I’d like to zoom in on a relatively recent method, diffusion tensor imaging (DTI), as a way of taking stock of what we know and understand about this incredible piece of machinery.
The human brain comprises many parts that work in concert to allow for all kinds of behavior. In any Introduction to Psychology class that touches on the brain, we learn about neurotransmitters being transported from one neuron to another across brain regions in order to signal different parts of the brain to perform certain actions. However, these neurotransmitters don’t just float randomly through the brain. Instead, electrical signals (known as action potentials) travel via axons, which bundle together to act as a kind of highway to guide messages between neurons in different brain regions, and these action potentials signal neurons to release or inhibit the release of neurotransmitters. Whereas a commonly used imaging method, magnetic resonance imaging (MRI), focuses on the gray matter of the brain – the bodies (or soma) of neurons – DTI focuses on the bundles of axons between these soma, or the white matter. White matter is made up of the axons and their surrounding myelin sheaths (see figure 1). The myelin sheath, in turn, is a protective barrier around axons that acts as a kind of insulation, like the casing around a wire. This post won’t go into detail about the intricacies of information transmission in the brain, but if you’d like to know more about it, there are dozens of well-made, informative YouTube videos that outline the steps of neurotransmission in great detail!
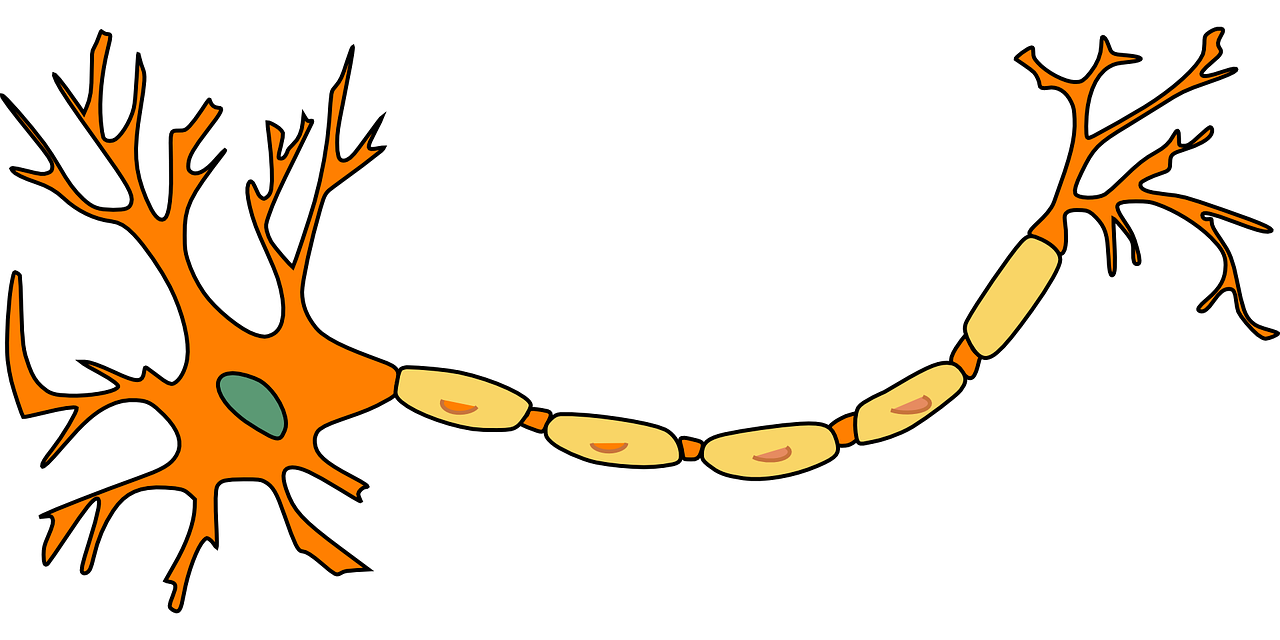
Figure 1. A neuron, where the larger part to the left is the soma and the yellow areas represent the myelin sheath protecting the axon.
DTI is an imaging method that provides researchers with information about the architecture of the brain using the magnetic field of an MRI machine and water molecules. The idea of diffusion imaging has been around for several decades, first described as an imaging method in 1985 (Merboldt, Hänicke, & Frahm 1985), and has gained much popularity since then – a Google Scholar search for “diffusion tensor imaging” reveals over 12,000 publications just in the year 2018. While the method involves a lot of intricate mathematics and physics to truly understand, the basic idea is fairly straightforward. In a sentence, DTI can show us the direction in which water molecules diffuse in the brain. In an unrestricted area, water molecules have the ability to diffuse freely in all directions in three-dimensional space. However, because of the bundles of axons organized throughout the brain, water encounters barriers and is prevented from flowing in certain directions. So while we cannot directly image the white matter, DTI allows us to infer from water diffusivity what the organization is of these highways throughout the brain.
The brain consists of so many neurons (multiple billions, in fact) that it would take several lifetimes to try to make sense of all of the connections between them. In psychology and neuroscience research, we tend to focus on particular bundles, also known as tracts, that we hypothesize have some functional purpose. Through DTI, we can draw conclusions about the strength of the connections between different brain regions based on different kinds of statistical inferences (see figure 2). One way we measure the strength of these tracts is through fractional anisotropy (FA), which is an indirect method for measuring tract strength. It is reported as a value between 0 and 1 that tells us how freely water is able to diffuse in our particular white matter tract of interest, where 0 indicates unrestricted (or isotropic) diffusion. The idea is that the higher the FA value, the more organized that tract is (and so the more restricted water flow is along that tract), which can then be interpreted in the context of what brain regions that tract connects.
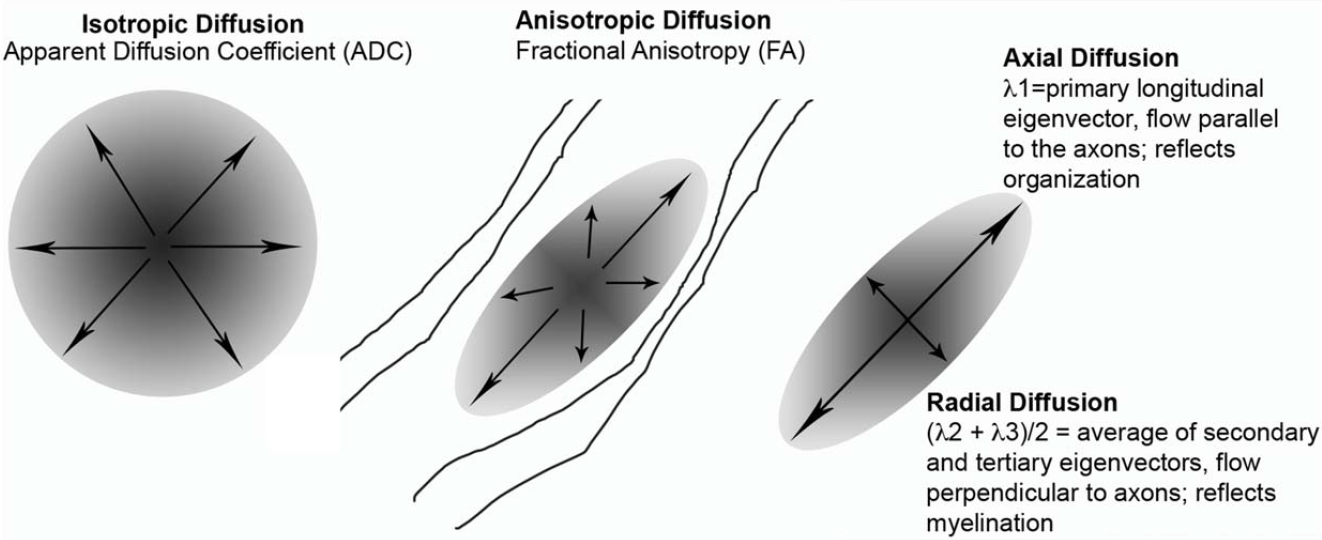
Figure 2. From Karlsgodt et al. 2012. A visual representation of what we can measure with data collected through DTI.
What we can learn from FA can probably best be understood in the context of an actual research study. In 2012, Dr. Katherine Karlsgodt and colleagues published a paper outlining differences in FA, as well as a few other measures of white matter, in patients with a genetic mutation known as neurofibromatosis-1 (NF1; which is linked to learning disabilities) compared to healthy controls. In this work, the researchers wanted to investigate white matter microstructural changes in the NF1 mutation; that is, how individual tracts are differing between patients and controls. They took two main approaches to answer this questions: in their first approach, which looked at the whole brain to find anywhere that white matter was altered in the NF1 patients, they found significant reductions in FA in the frontal lobe. In their second approach, which looked specifically at particular tracts of interest, they found group reductions in bilateral anterior thalamic radiations as well as left cingulate bundle. Without going into too much detail about the tracts and brain regions mentioned here, these results are mainly associated with the frontal lobe, which is a region heavily involved in higher order cognition. As patients with the NF1 mutation tend to have significant cognitive deficits, these results fit the profile of the illness. These kinds of data can therefore be very informative as researchers try to understand the neurological nature of behavior.
As useful as DTI is, it is important to note that there is no such thing as a perfect method for studying the brain. As with anything else, there are limitations to using DTI as a method to study the architecture of the brain. Firstly, as has been mentioned already, DTI does not directly measure white matter tracts. Instead, it measures the ability of water molecules to diffuse along the tracts. This is a good proxy for what we’re actually trying to study, but is of course not exact. Therefore, we must always be wary of how we interpret any values that come out of a DTI analysis because we cannot say with certainty that what we are measuring is actually white matter tracts. Secondly, aside from the interpretation of DTI results, we must also be wary of the ways in which these data are analyzed. As with any imaging method, the raw data collected from each participant in a study must be manipulated to an extent before it really becomes meaningful on a group level. While there do exist some standards for how this manipulation occurs, different researchers or groups may have different methods for how they clean and subsequently analyze their data, for instance in what threshold of diffusivity they select to distinguish white matter from gray matter (that is to say, how freely must water be able to diffuse before it is classified as gray matter).
As research methods have become more and more advanced, researchers have developed more and more sophisticated approaches to tackling the brain’s mysteries. In the past few decades, DTI has proven itself to be a popular method of measuring white matter and understanding the relationships between different tracts in the brain and the behaviors with which they correlate. When used in conjunction with other imaging methods (such as MRI to look at gray matter in the brain) and behavioral methods (from self-report to task-based measures), DTI affords us an additional piece in the puzzle of the human mind.
References:
Karlsgodt, K. H., Rosser, T., Lutkenhoff, E. S., Cannon, T. D., Silva, A., & Bearden, C. E. (2012). Alterations in white matter microstructure in neurofibromatosis-1. PLoS One, 7(10), e47854.
Merboldt, K. D., Hanicke, W., & Frahm, J. (1985). Self-diffusion NMR imaging using stimulated echoes. Journal of Magnetic Resonance (1969), 64(3), 479-486.